Updating and Extending Monitoring Dashboards
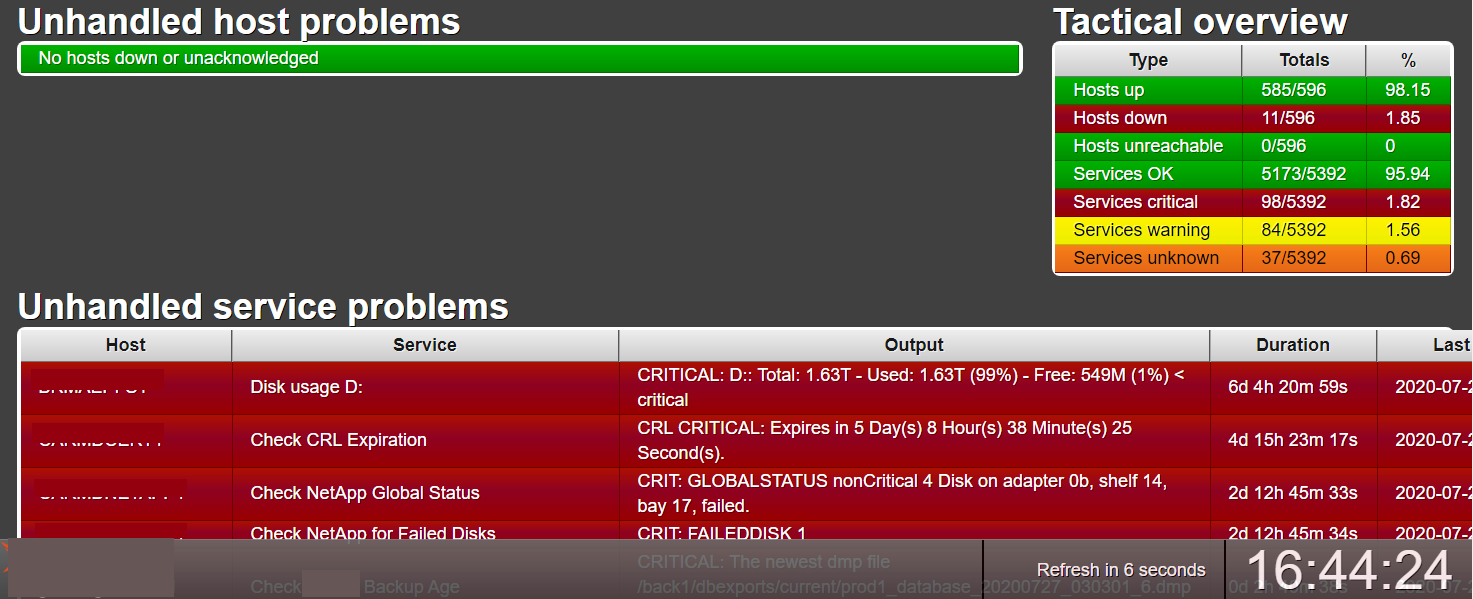
We’ve been using (a now somewhat antiquated version) of Op5 for monitoring at work for as many years as I can remember. We needed a nice simple, no-login whilst on the WAN, dashboard to display the current status of our servers on TV screens in each of our IT office locations around the globe. Our original Op5 implementer pointed us towards the merlin-dashboard by Mattias Bergsten which fit our requirements perfectly.
Over the years as Op5 has been upgraded through numerous versions and backend changes, so I’ve tweaked this dashboard to fit our ongoing requirements. First updating the look a little using Bootstrap, and then adding in some additional useful info from other systems running in our environment. So that it now looks like the screenshot below (I’ve removed identifiable info from the screenshots, so please excuse the odd coloured parts!).
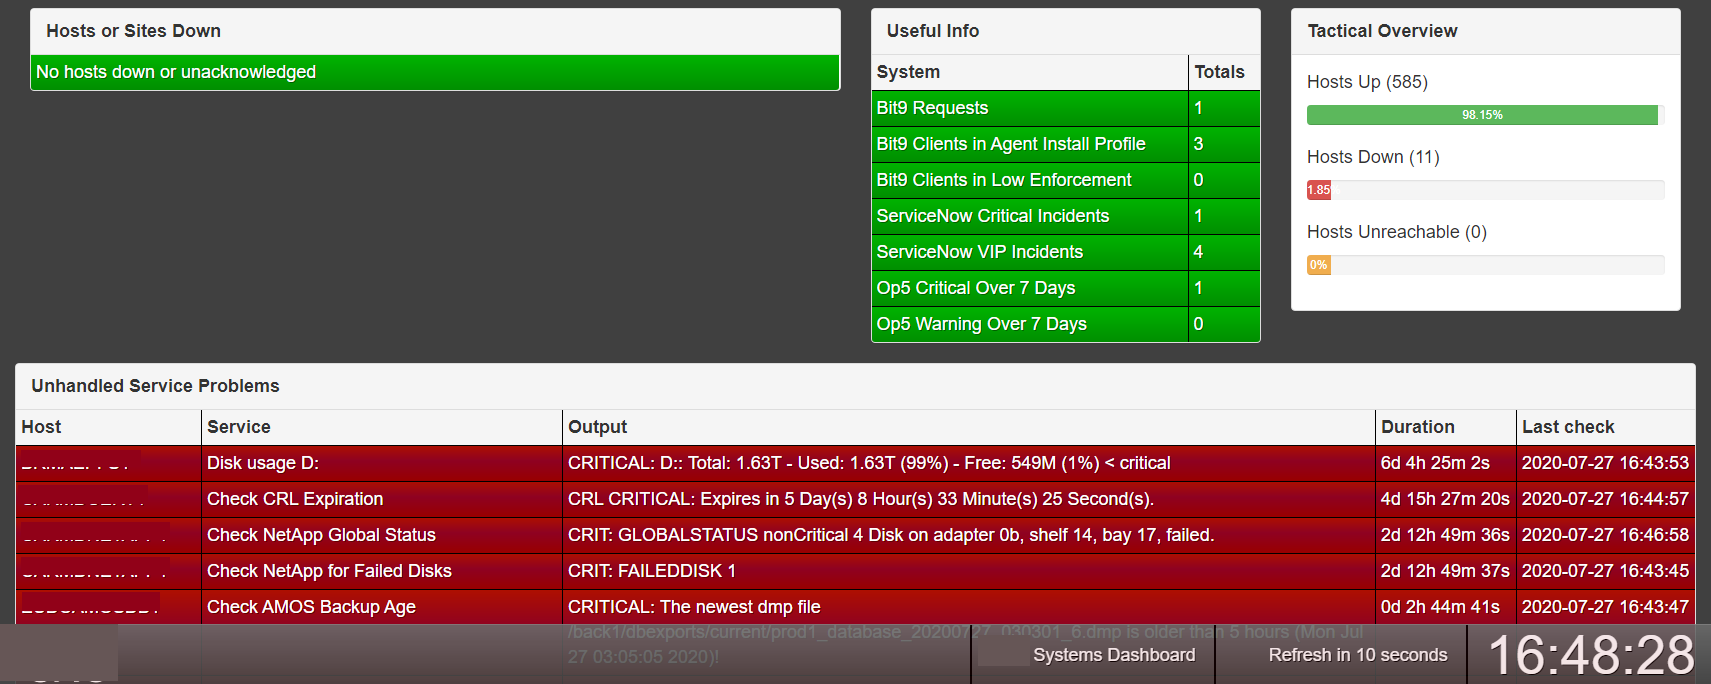
One of the best things to happen over the years, in my opinion, has been the tendency for software packages to implement public API’s. These can be used to request stats for the purposes of updating in-house dashboards. Two of the systems I’ve added to our dashboard have been our application white-listing suite (Carbon Black Protection, previously Bit9), and our ticketing system (Service-Now). All the IT offices now have an easy way to see if anyone is awaiting an application approval, or whether there’s suddenly been an uptick in critical Service Desk tickets.
This has been achieved using a few Python scripts I wrote which are executing via cron. These query the respective systems and update a small DB on the monitoring server, which is then queried on each dashboard refresh.